
Following a strong move the week before, the markets took on a more consolidatory look over the past five sessions. Following ranged moves, the Nifty closed the week on just a modestly positive note. From a technical standpoint, the Nifty tested a few important levels on both daily and weekly charts. However, the trading range narrowed. The Index oscillated in a 517.60-point range over the past week. The volatility surged again; the India VIX spiked 10.93% to 17.16. The headline index went on to close with a modest weekly gain of 187.70 points (+0.79%).
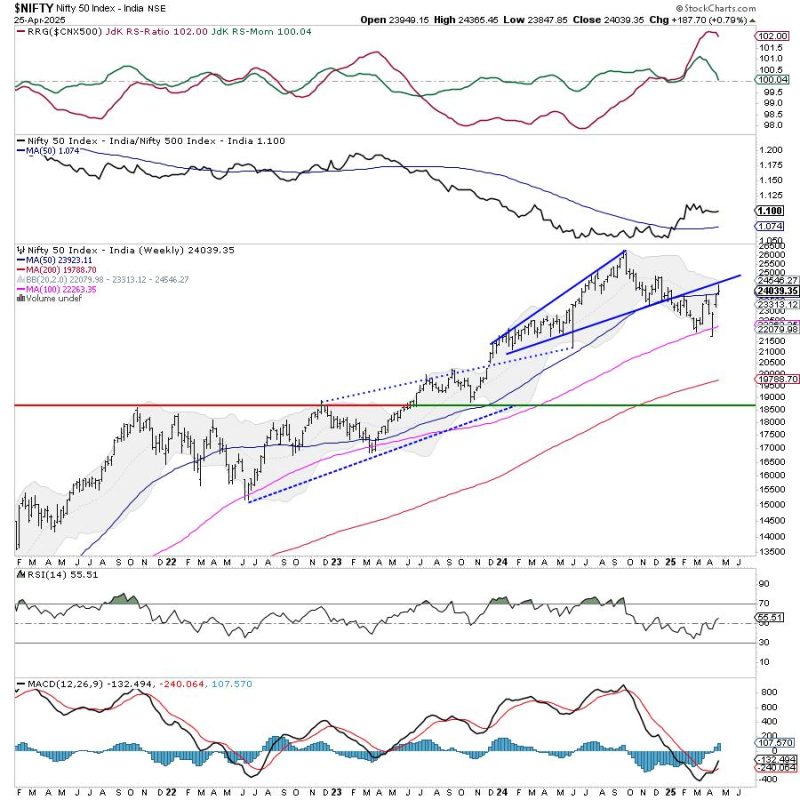
The coming week is shortened, with Thursday being a trading holiday due to Maharashtra Day. We could write about more than one thing that the markets could be worried about over the coming days. It could be the lowered growth forecasts by the IMF that include India and other economies; it could also be the heightened possibility of escalating geopolitical tensions between India and Pakistan. However, all that said, the markets are also at a crucial technical juncture. The Nifty has closed just at the 200-DMA placed at 24050. Besides this, Index has also defended the 50-week MA at 23925. This makes the 23,900-24,050 zone a crucial support area for the Nifty. The consolidation is imminent as the Nifty has rebounded over 11% from its April 07 lows, and minor corrective retracements cannot be ruled out. However, if 23900 is breached, the markets may see some extended retracements.
The weekly RSI is at 55.46; it stays neutral and does not show any divergence against the price. The weekly MACD is bullish and stays above its signal line. A candle resembling a Shooting Star has emerged, increasing the likelihood of consolidation. Importantly, any candle formation should not be traded in isolation and must be used in conjunction with the overall technical setup.
The pattern analysis shows that the Nifty has defended the 50-week MA placed at 23925. The Index has also tested a rising trendline resistance; it violated this trendline support on its way down, and now this is expected to act as resistance. Overall, the zone of 24050-23900 is a crucial support zone for Nifty. If the level of 23900 is violated, it can lead to incremental weakness.
Overall, the technical structure of the market suggests that it is time for one to focus more on protecting gains at higher levels. While there could be some reactions by the markets due to external factors, the underlying buoyancy stays intact. The only thing to be cautious about is the natural corrective retracements that the market may experience following the steep upward move that has taken place. Investors must keep fresh purchases should be kept in low-beta stocks that have strong relative strength. With sector rotation visible, a cautious outlook is advised for the day.
Sector Analysis for the coming week
In our look at Relative Rotation Graphs®, we compared various sectors against CNX500 (NIFTY 500 Index), which represents over 95% of the free float market cap of all the stocks listed.
Relative Rotation Graphs (RRG) show the Nifty PSU Bank Index has rolled inside the leading quadrant. The Consumption, Commodities, Financial Services, Infrastructure, Metal, and Nifty Bank Indices are also inside the leading quadrant. While the weakening of Relative Momentum is seen in the Metal and Financial Services Index, they are likely to outperform the broader markets relatively.
The Nifty Services Sector Index has rolled inside the weakening quadrant.
The Midcap 100 and the Realty Index are showing strong improvement in their Relative Momentum while staying inside the lagging quadrant. The IT and the Auto Index continue to languish inside the lagging quadrant.
The Media Index has rolled inside the Improving quadrant, indicating a likely beginning of its phase of relative outperformance. The Nifty PSE, Energy, and FMCG Indices are also inside the improving quadrant.
Important Note: RRG charts show the relative strength and momentum of a group of stocks. In the above Chart, they show relative performance against NIFTY500 Index (Broader Markets) and should not be used directly as buy or sell signals.
Milan Vaishnav, CMT, MSTA
Consulting Technical Analyst